4.7 KiB
Android platform profiling
[TOC]
General Tips
Here are some tips for Android platform developers, who build and flash system images on rooted devices:
- After running
adb root, simpleperf can be used to profile any process or system wide. - It is recommended to use the latest simpleperf available in AOSP main, if you are not working
on the current main branch. Scripts are in
system/extras/simpleperf/scripts, binaries are insystem/extras/simpleperf/scripts/bin/android. - It is recommended to use
app_profiler.pyfor recording, andreport_html.pyfor reporting. Below is an example.
# Record surfaceflinger process for 10 seconds with dwarf based call graph. More examples are in
# scripts reference in the doc.
$ ./app_profiler.py -np surfaceflinger -r "-g --duration 10"

# Generate html report.
$ ./report_html.py
- Since Android >= O has symbols for system libraries on device, we don't need to use unstripped
binaries in
$ANDROID_PRODUCT_OUT/symbolsto report call graphs. However, they are needed to add source code and disassembly (with line numbers) in the report. Below is an example.
# Doing recording with app_profiler.py or simpleperf on device, and generates perf.data on host.
$ ./app_profiler.py -np surfaceflinger -r "--call-graph fp --duration 10"

# Collect unstripped binaries from $ANDROID_PRODUCT_OUT/symbols to binary_cache/.
$ ./binary_cache_builder.py -lib $ANDROID_PRODUCT_OUT/symbols

# Report source code and disassembly. Disassembling all binaries is slow, so it's better to add
# --binary_filter option to only disassemble selected binaries.
$ ./report_html.py --add_source_code --source_dirs $ANDROID_BUILD_TOP --add_disassembly \
  --binary_filter surfaceflinger.so
Start simpleperf from system_server process
Sometimes we want to profile a process/system-wide when a special situation happens. In this case, we can add code starting simpleperf at the point where the situation is detected.
-
Disable selinux by
adb shell setenforce 0. Because selinux only allows simpleperf running in shell or debuggable/profileable apps. -
Add below code at the point where the special situation is detected.
try {
  // for capability check
  Os.prctl(OsConstants.PR_CAP_AMBIENT, OsConstants.PR_CAP_AMBIENT_RAISE,
           OsConstants.CAP_SYS_PTRACE, 0, 0);
  // Write to /data instead of /data/local/tmp. Because /data can be written by system user.
  Runtime.getRuntime().exec("/system/bin/simpleperf record -g -p " + String.valueOf(Process.myPid())
            + " -o /data/perf.data --duration 30 --log-to-android-buffer --log verbose");
} catch (Exception e) {
  Slog.e(TAG, "error while running simpleperf");
  e.printStackTrace();
}
Hardware PMU counter limit
When monitoring instruction and cache related perf events (in hw/cache/raw/pmu category of list cmd),
these events are mapped to PMU counters on each cpu core. But each core only has a limited number
of PMU counters. If number of events > number of PMU counters, then the counters are multiplexed
among events, which probably isn't what we want. We can use simpleperf stat --print-hw-counter to
show hardware counters (per core) available on the device.
On Pixel devices, the number of PMU counters on each core is usually 7, of which 4 of them are used
by the kernel to monitor memory latency. So only 3 counters are available. It's fine to monitor up
to 3 PMU events at the same time. To monitor more than 3 events, the --use-devfreq-counters option
can be used to borrow from the counters used by the kernel.
Get boot-time profile
On userdebug/eng devices, we can get boot-time profile via simpleperf.
Step 1. Customize the configuration if needed. By default, simpleperf tracks all processes
except for itself, starts at early-init, and stops when sys.boot_completed is set.
You can customize it by changing the trigger or command line flags in
system/extras/simpleperf/simpleperf.rc.
Step 2. Add androidboot.simpleperf.boot_record=1 to the kernel command line.
For example, on Pixel devices, you can do
$ fastboot oem cmdline add androidboot.simpleperf.boot_record=1
Step 3. Reboot the device. When booting, init finds that the kernel command line flag is set,
so it forks a background process to run simpleperf to record boot-time profile.
init starts simpleperf at early-init stage, which is very soon after second-stage init starts.
Step 4. After boot, the boot-time profile is stored in /tmp/boot_perf.data. Then we can pull the profile to host to report.
$ adb shell ls /tmp/boot_perf.data
/tmp/boot_perf.data
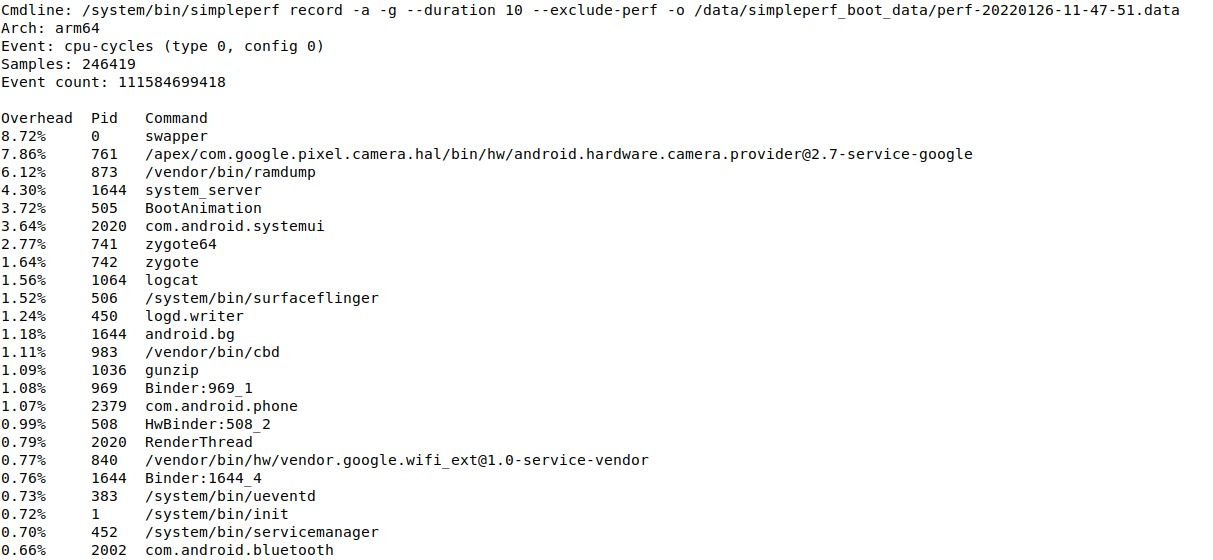
Following is a boot-time profile example. From timestamp, the first sample is generated at about 4.5s after booting.
